
Moisture mapping means taking readings at set points across a grid on a wall, floor or ceiling and plotting them to show where damp is worst and how it fades outward. Instead of one damp-meter reading in isolation, the pattern of readings points toward the likely source. Engineers usually pair it with thermal imaging, since heat loss patterns and moisture gradients often confirm each other.
In This Guide
What moisture mapping actually is
A single moisture reading tells you one thing: this exact point is wetter than dry material should be. It does not tell you where the water is coming from, which direction it travelled, or whether the source is a metre away or five. Moisture mapping fixes that gap by taking many readings across a defined grid, then plotting them so a pattern emerges rather than a lone number.
Once you have a grid of readings, you can see where moisture is highest and trace how it falls away in each direction. Water tends to spread from a source and lose concentration as it moves further from it, so the reading pattern itself becomes a rough compass pointing back toward the leak.
This matters most in older Scottish properties, where solid stone or granite walls hold and move moisture very differently to modern cavity construction. A single reading on a granite wall can be misleading on its own; a mapped grid across the same wall tells a much clearer story.
How the grid readings are taken
An engineer marks out a grid across the affected area, typically at regular intervals across a wall, ceiling or floor, and takes a moisture reading at every point using a pin or non-invasive meter. Each reading gets logged against its position on the grid rather than treated as a standalone figure.
Step 1: Define the survey area
The engineer marks out the boundary of the suspect area, usually extending well beyond the visible stain or damp patch, since moisture often travels further than it shows on the surface.
Step 2: Take readings at each grid point
A reading is logged at every intersection of the grid, building up a full data set across the whole surface rather than a handful of spot checks.
Step 3: Plot the readings into a map
The readings are arranged into a visual grid or heat-style chart, with the highest moisture levels standing out clearly against the drier surrounding readings.
Reading the gradient: why direction matters
The real value in moisture mapping is not any single high reading, it is the gradient between readings. If moisture levels are high in one corner of the grid and fall away steadily in every direction from that point, the source is very likely near that corner. If two separate high points appear on the grid with dry readings between them, that suggests two different problems rather than one leak spreading unevenly.
We see this pattern often in tenement flats: a damp patch on a bedroom ceiling maps out with the highest readings closest to an internal wall rather than the external one, which points the engineer toward a common pipe run rather than penetrating damp from outside. Without the grid, that distinction is nearly impossible to make from a single reading.
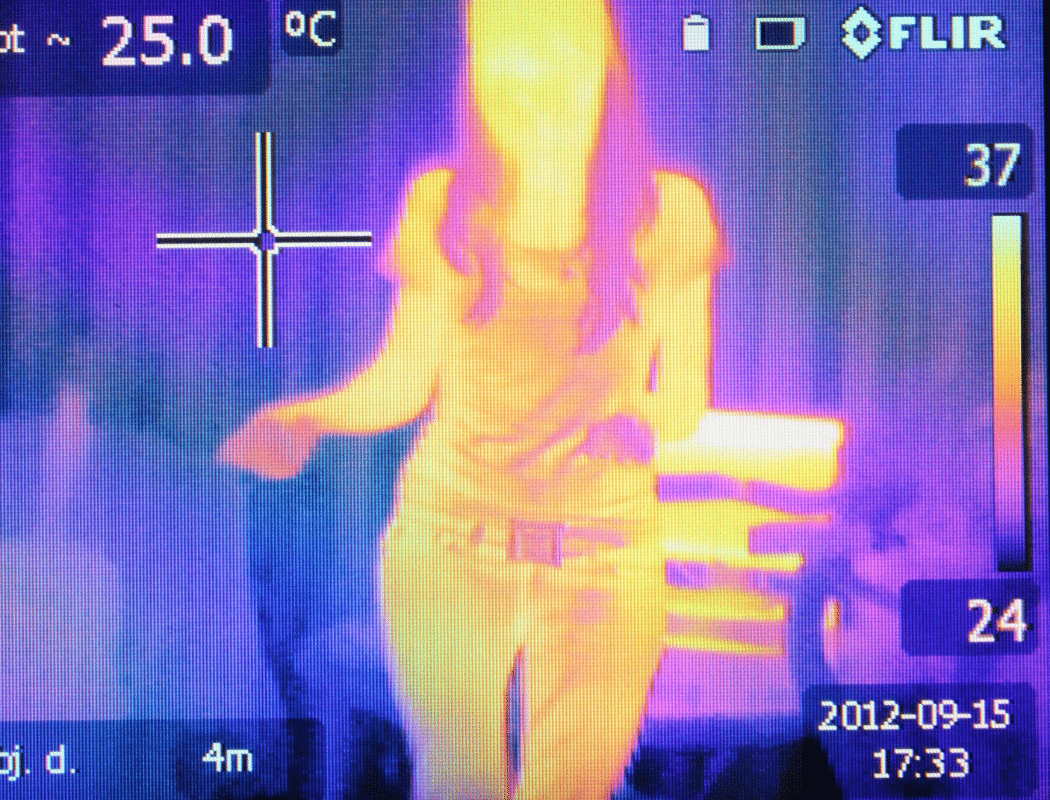
What the combined data looks like on screen
Moisture readings plotted alongside a thermal image let an engineer see two independent data sets pointing at the same spot. When a moisture gradient and a thermal cold spot line up, that is a strong sign the leak source has been narrowed down correctly rather than by coincidence.
Pairing moisture mapping with thermal imaging
Moisture mapping tells you where water is, but not always why it is there or exactly which pipe is responsible. Thermal imaging adds a second, independent layer of evidence: a leaking pipe often creates a localised cold patch as water evaporates and draws heat from the surrounding material, visible on a thermal camera even where nothing is visible to the naked eye.
Used together, the two methods cross-check each other. A moisture gradient pointing toward one wall, matched by a thermal cold spot in the same location, gives far more confidence than either method alone. This combination is central to how thermal imaging leak detection is carried out on real jobs, rather than relying on either tool in isolation.
If you want the fuller picture of how the thermal side works on its own, our guide on how thermal imaging finds hidden water leaks covers that in more detail.
Chasing a damp patch that will not explain itself?
Moisture mapping and thermal imaging together give a clear picture of where a leak actually sits, before anyone lifts a floorboard or opens a wall. We carry both out as standard on every survey.
What a mapped report looks like
A finished moisture map is usually presented as a simple grid or plan view of the surveyed area, with numbered or colour-coded readings showing intensity at each point. Alongside it sits the corresponding thermal image, so anyone reading the report, a homeowner, a loss adjuster, a factor, can see both data sets side by side rather than relying on a written description alone.
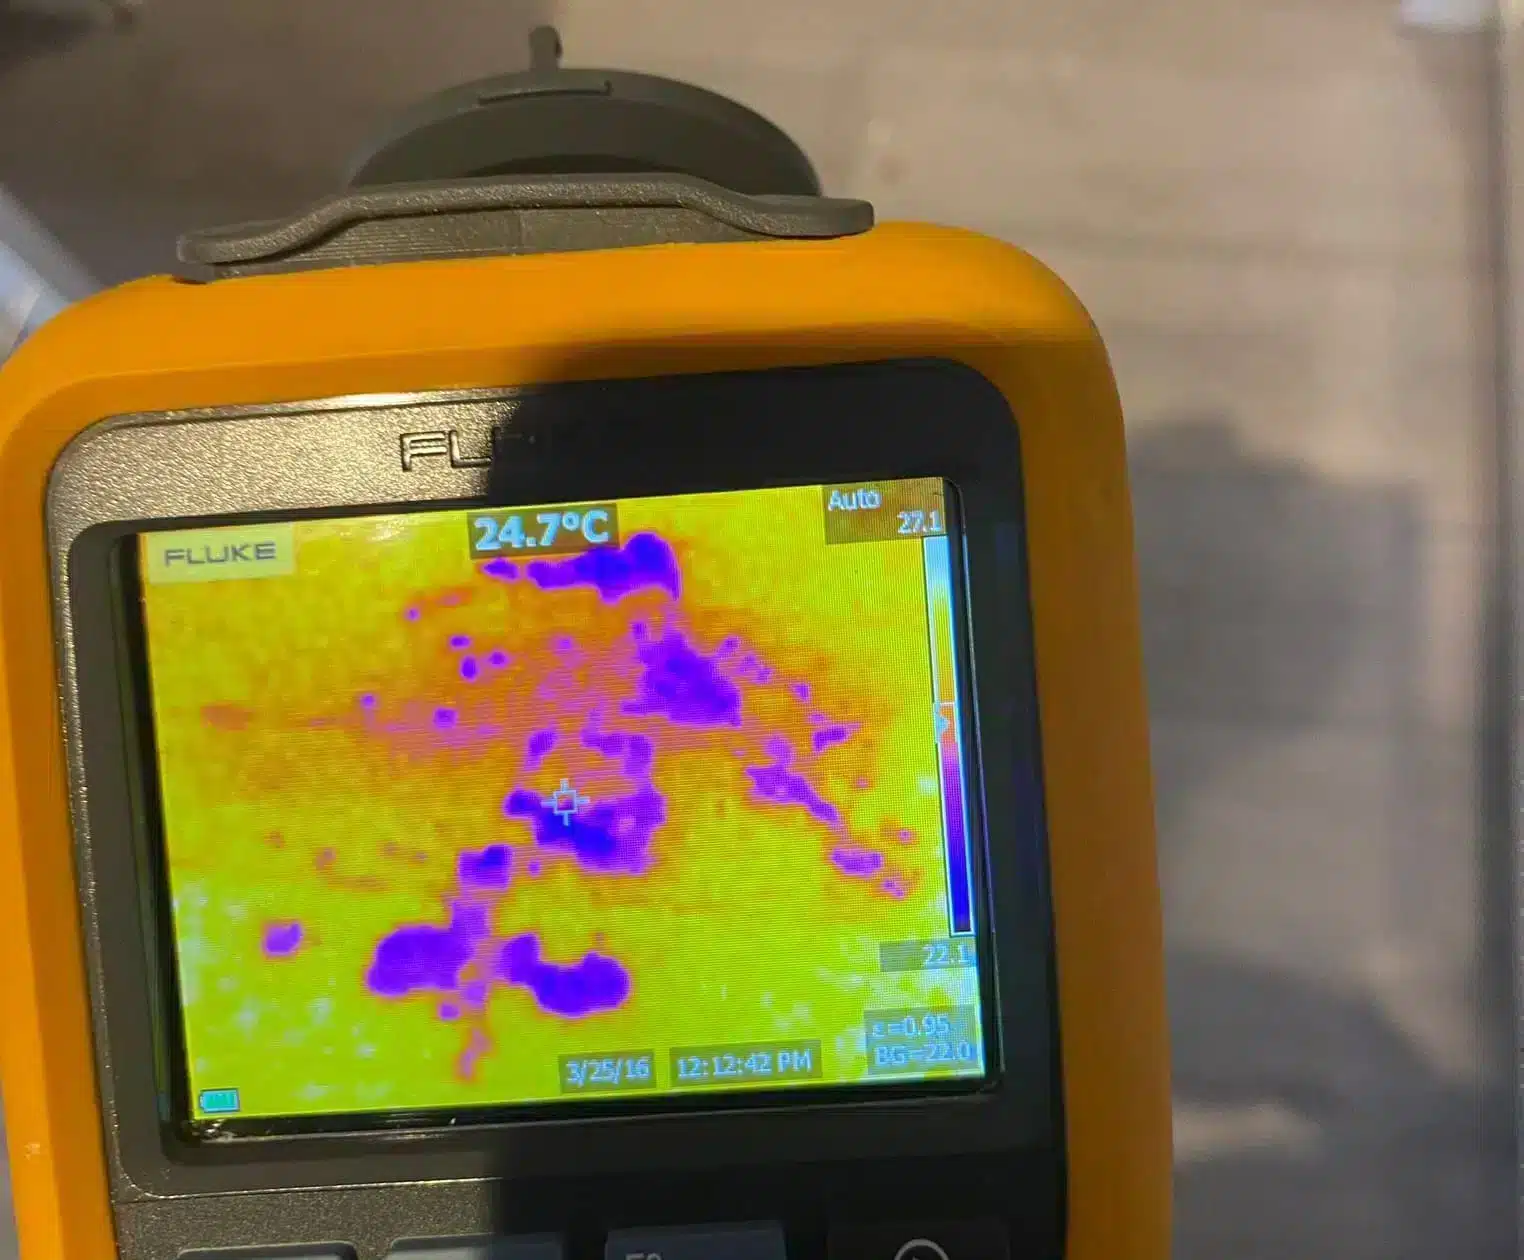
Why the visual record matters for a report
A report built from mapped readings and thermal images stands up better under scrutiny than a written note with a vague description of damp near the kitchen wall. Anyone assessing the claim can see exactly where readings were taken and how the pattern points to the source.
- Grid position logged for every reading taken, not just the highest ones.
- Gradient direction showing which way moisture falls away from the suspected source.
- Thermal cross-reference confirming or challenging the moisture pattern independently.
- Photographic record of the affected area for context alongside the data.
Where moisture mapping struggles on its own
Moisture mapping has limits. It reads surface and near-surface moisture well, but it cannot see through thick masonry or tell you precisely which of several pipes behind a wall is responsible. Certain building materials also hold naturally higher background moisture, plaster in an older tenement close, for instance, which can make a mapped grid harder to interpret without local knowledge of what is normal for that type of construction.
Moisture mapping alone works well for
- Confirming the general area a leak sits in
- Tracking how far existing damage has spread
- Distinguishing rising damp patterns from a point-source leak
Needs pairing with another method for
- Pinpointing the exact pipe behind a wall or floor
- Confirming a leak is active rather than historic residual damp
- Very thick stone or granite walls with high natural moisture retention
This is why a proper survey rarely relies on moisture readings by themselves. Acoustic listening and tracer gas both bring different strengths, and our guide on how acoustic leak detection works explains how sound-based methods fill in some of the gaps moisture mapping leaves.
Why this matters for insurance claims
A moisture map with dated, positioned readings is far more useful to a loss adjuster than a verbal description of a damp feeling near the corner. It shows exactly where readings were taken, what they measured, and how the pattern supports the conclusion about where the leak sits.
Combined with a thermal imaging record, a mapped survey forms part of the insurance-approved reports we provide, giving a documented, repeatable basis for a claim rather than a single engineer’s unrecorded opinion.
Moisture readings taken shortly after any water use, a shower running, a washing machine cycle, can be temporarily skewed. A proper survey accounts for this by taking readings at a sensible point after normal water use has settled, not immediately after.
Frequently Asked Questions
Moisture mapping is the process of taking readings across a grid of points on a wall, floor or ceiling and plotting them to show where dampness is highest. The pattern of readings, not a single number, helps point toward the likely source of a leak.
A damp meter takes one reading at a time. Moisture mapping uses many readings across a defined grid and plots them together, turning individual numbers into a pattern that shows direction and intensity of dampness across a whole area.
Moisture mapping shows where damp is worst, while thermal imaging shows temperature patterns linked to evaporation from a leak. When both point to the same location, that gives much stronger confidence in the source than either method alone.
Not always on its own. It narrows down the general area effectively but often needs pairing with thermal imaging or acoustic listening to confirm the specific pipe or fitting responsible, especially behind thick walls.
Yes, but these materials naturally hold more background moisture than modern cavity walls, so readings need interpreting with that in mind. A grid of readings across the wall still shows useful gradients even where the baseline moisture is higher.
Yes. A mapped survey with positioned, dated readings and an accompanying thermal image gives a loss adjuster a documented basis for assessing a claim, which is more useful than a description of damp without recorded data behind it.
📍 Professional Leak Detection Across Scotland
See exactly where your leak is coming from
Don’t let a small problem become a big one. Our surveys combine moisture mapping with thermal imaging to give you a clear, evidence-backed picture of where water is coming from, with insurance-approved reports as standard.